
Pharmacokinetics is the study of drug absorption, distribution, metabolism, and excretion over time. We often want to apply pharmacokinetic principles to the safe and effective therapeutic management of drugs in patients, but it may be difficult to measure drug concentrations in specific tissues. While we can easily measure drug concentrations in places like blood, urine, saliva, it can be much harder or impossible to measure drug concentrations in other tissues like in the subcutaneous space. However, easily obtained measurements can be leveraged to develop pharmacokinetic models to predict drug concentrations in other tissues where we cannot feasibly collect data from. Compartment models can be generated by dividing the body into compartments that describe the absorption, distribution and elimination. Pharmacokinetic models can be extremely valuable to drug research and development, shedding light to how a drug candidate interacts with the target organism.
This application is designed to aid researchers who are currently developing and researching drugs for deployment in animal models
or other subjects. This tool consists of two parts that operate entirely independently, although both can be used at the same time.
For the full documentation, please visit the Github repository where a README has been uploaded to go into more detail
here.
It should also be noted that supporting files for this application including a commented version of the Python code in this web application
and a sample Jupyter Notebook for download that mimics the functionality of this application (allowing for greater end-user customizability)
is available here.
Note: you will notice some stutters as packages load in as soon as you press the "Load-in Packages" button in part 2.
This is completely normal. Additionally, the "Calculate k-values" button in part 2 is grayed out until said packages load -
this can take up to 30 seconds. The Rate Constant Calculator runs ONLY in Chrome and Firefox.
Safari is only compatible with the first part of the calculator.
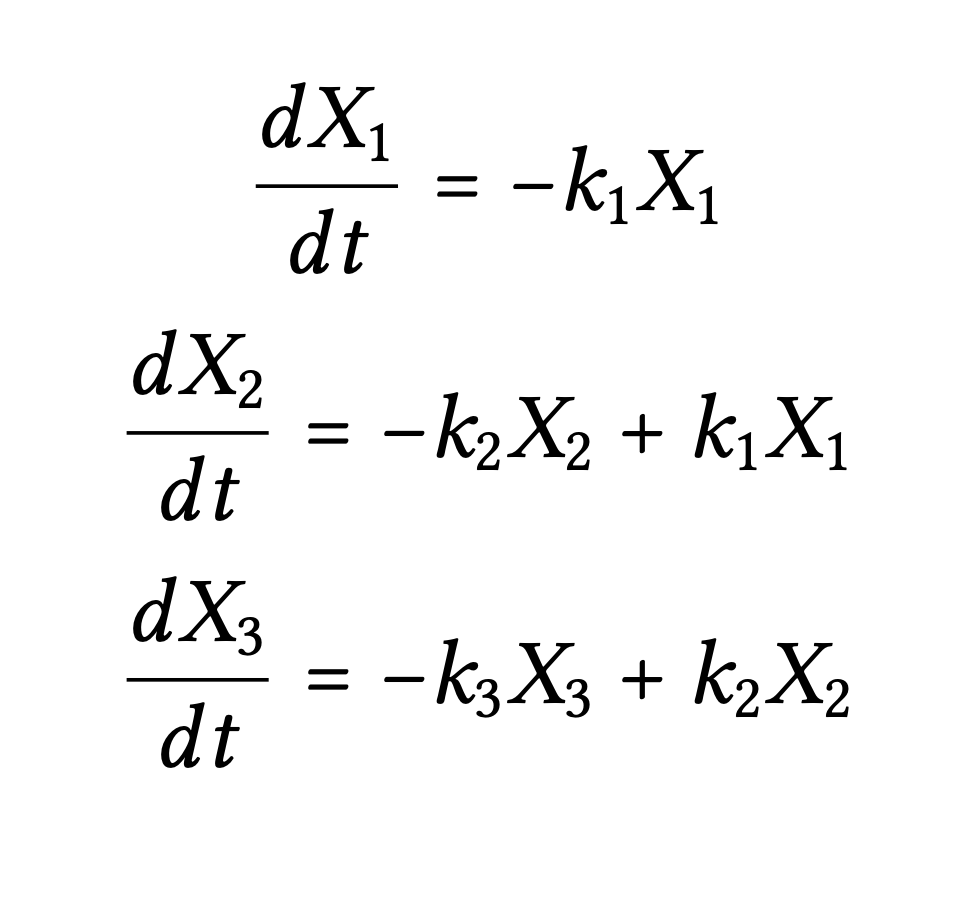
This example system illustrates the model set-up for both parts of the application. In both parts, the user will be able to define the number of compartments in their model system. Each compartment starts with an initial mass and the application uses first-order kinetics to model flow in and out of each compartment. We have chosen to use a 3 compartment model as an example for the inputs and corresponding system of differential equations. The flow is dictated by the rate constants labeled as k1, k2, and k3 in our example picture. Initial mass in each compartment is given by X1,0, X2,0, X3,0. X1, X2, and X3 correspond to the mass in compartments 1, 2, and 3 at a given time t.
The differential equations used in the calculator, resemble the following, where each compartment's derivative is modified by the incoming mass and outgoing mass, where *X* represents the mass of a compartment.
The Pharmacokinetic Data Modeling Calculator and Visualizer allows users to set up a system of ordinary differential equations (ODEs) describing a simple compartment model with first-order kinetics and then solve and plot the drug profiles in each compartment over time.
Animal Model Constant:
While modeling mass transfer between systems is typically easiest,
often to compare the amount of drug in the body to the efficacious therapeutic dose (or cytotoxic dose)
a concentration is required. The Animal Model Constant is a conversion factor that allows you to convert
mass to concentration (typically (blood volume)-1 or (distribution volume)-1. This will vary between
animal models and so users will have to determine the conversion appropriate for their system.
At present this application only supports one conversion factor and so for systems where one would need
to use a different conversion factor for each compartment we recommend only converting to concentration
for the compartment of interest or keeping all compartments in terms of mass. You are allowed to put in
mathematical expressions or numbers here.
After inputting the parameters for your system, you can press the Calculate & Graph button which will solve the system of ODEs using a 4th order Runge-Kutta ODE solver and generate mass vs. time or concentration vs. time curves for each compartment. The results will be graphed and can also be downloaded as a CSV to be plotted by the user.
The Rate Constant Calculator allows users to set up a system of ordinary differential equations (ODEs) describing a simple compartment model and input a CSV containing experimental data, then have an optimizing algorithm run to fit the data to a set of k-values.
Finally, you can press the "Calculate k-values" button which will parse your inputs and return final k-value results for each compartment. For specifics as to how this is done check-out the Python files which the code from this app is based on and the methodologies section in the full documentation for this web application. There is also an example Jupyter Notebook that can be customized to your specific situation. The link to that repository is here. Enjoy and best of luck with your research!
Visit the full documentation page for tips on troubleshooting.